
Electrode Uniformity


Turning towards a better future
Electrode uniformity is critical to a battery’s success. But achieving uniformity can come with many pitfalls and balancing acts. Below we discuss what can lead to a lack of uniformity (heterogeneity), the difficulties in achieving uniformity (homogeneity), and some suggestions for the production environment.
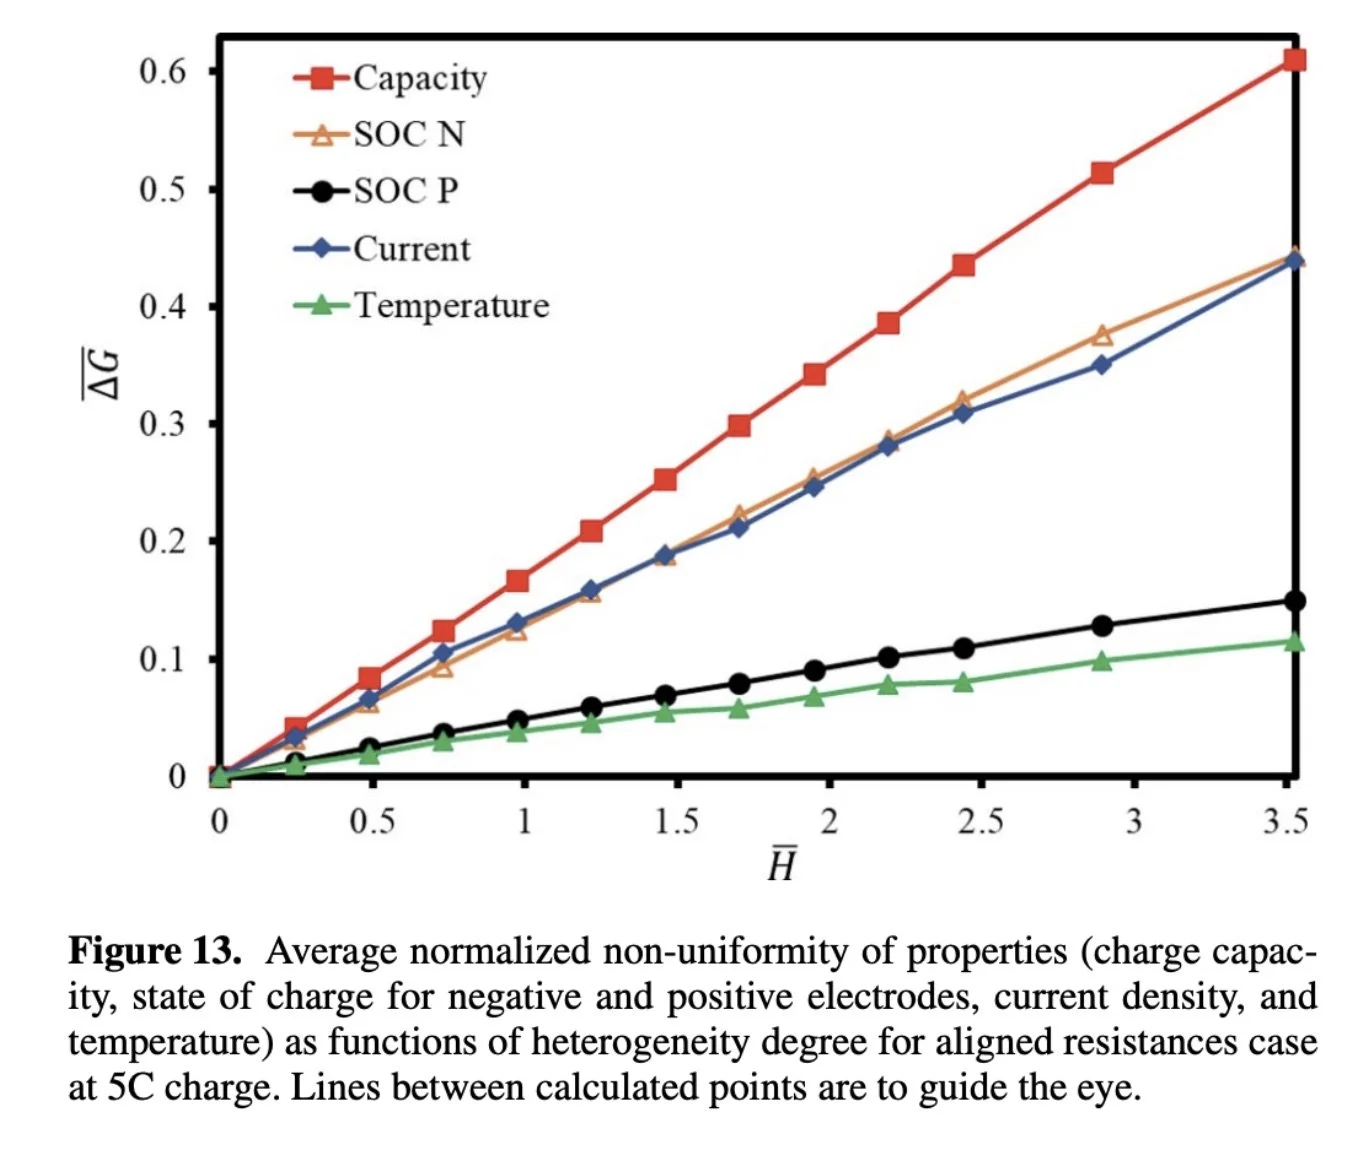
Forouzan et al’s paper looked at the effects of electrode heterogeneity on Li ion battery performance and lifetime. This paper looked at the effects of high, average, and low resistance spots within battery electrodes as well as high, average, and low active material loading. For resistance, aligned charging was tested (aligned meaning high resistance anodes and cathodes were used, then medium resistance, then low), and misaligned discharging was tested (misaligned meaning cathodes and anodes of varying resistance levels were used). For active material loading, misaligned discharging cases (misaligned meaning the cathode and anode had different loading levels) were examined.
They found that the severity of heterogeneity has the greatest effect on cell capacity and the least effect on cell temperature. They also found that misaligned active material loading levels cause more cell degradation compared to misaligned resistances, particularly for the negative electrode. In cases of cycling with aligned resistance, regions of low resistance between both anode and cathode were used most heavily first, causing temperature increases and faster degradation, then mid resistance, then high resistance. Misaligned resistances often canceled on another out, leading to a performance similar to that of aligned mid resistance experiments. They concluded that increase in electrode homogeneity allows for longer cell life as well as a wider operating range of SOC.[1]
These types of heterogeneity are difficult to combat however, because steps like calendaring can decrease differences in active material loading level, but can make the distribution of particle types more heterogeneous.[2] Similarly, the drying process of the electrodes needs to be sufficiently quick to keep a good production pace, but a greater drying rate corresponds to binder migration, which can result in electrode delamination and capacity fade.[3] While tests like EIS, HiPot, cycle life, and calendar ageing can help determine production defects, there are limitations. For one, these tests are not spatially resolved, meaning diagnosing specific points of failure within the cell can be difficult. For cycle life and calendar tests in particular, it can take weeks or months to generate meaningful data.
Ultimately, achieving electrode uniformity is a tricky balancing act. Sometimes changes within the existing production lines can help solve the problem. For example, it has been suggested that a drying regimen which starts with a high drying rate and decreases towards the end of the process can help reduce binder migration.[3] Other times, it is a question of creating a robust and multifaceted inspection system that balances the cost associated with each inspection technique with the cost of potential failure without the technique. Determining the costs can itself be difficult, but below we use an example of implementing a 2D x-ray inspection. In the end, the costs of inspection equipment vs failures were shown in terms of kWh of the batteries produced.
Determining the costs of both implementation and failure requires simplifying assumptions to be made. Nevertheless, these calculations can be useful as a starting point. The cost of the x-ray can be broken down into the initial cost, amortized over multiple years, plus the yearly maintenance costs.
This cost can then be compared to the kilowatt hours of cells produced per year that would be imaged by the x-ray.
Dividing these two numbers can give you an accurate picture of the cost of a 2D x-ray being implemented during production per kilowatt hour being produced.
The cost of cell failure, on the other hand, can be estimated as follows:
By comparing these two numbers, companies can begin to get a more concrete idea of the potential benefits of individual inspection protocols and determine which could be most useful for their production environments.
While no bullet proof solution exists to increase electrode uniformity, understanding the types of heterogeneity that can occur, along with how they come about in the production process, is an excellent start. From there companies can begin to implement solutions with an eye both to possible process changes and inspection system improvements.
[1] Mehdi M. Forouzan et al 2018 J. Electrochem. Soc. 165 A2127
[2] M. Nikpour et al 2021 J. Electrochem. Soc. 168 060547
[3] F. Font et al 2018 J. Power Sources 393 177-185